Buy alert: XRP set for a major price move 
![]() Cryptocurrency Feb 23, 2025 Share
Cryptocurrency Feb 23, 2025 Share
After days of trading sideways, technical indicators suggest XRP might be gearing up for a decisive price move, even as the general cryptocurrency market trends downward.
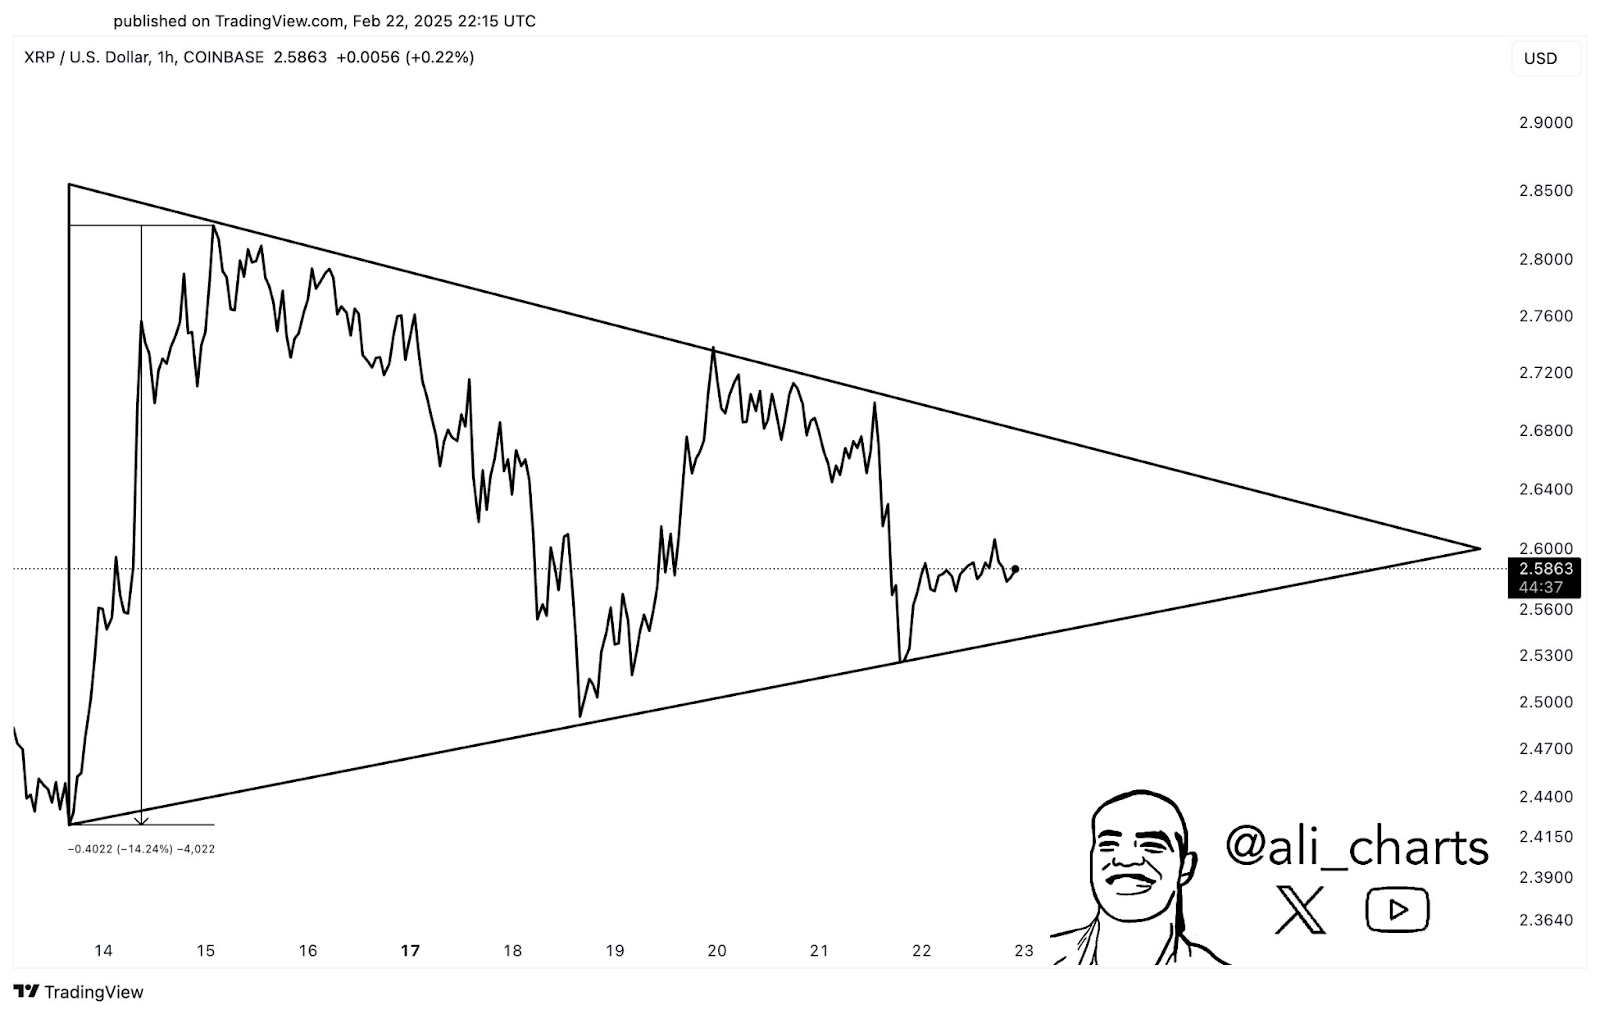
On the weekly chart, XRP has oscillated between $2.40 and $2.90, forming a symmetrical triangle pattern, a setup that often precedes a notable breakout, according to prominent cryptocurrency analyst Ali Martinez in an X post on February 23.
 XRP price analysis chart. Source: TradingView/Ali_charts
As per Martinez’s analysis, this formation indicates that XRP has the potential to rally by 14%. However, it is worth noting that symmetrical triangles suggest a breakout could go either way, meaning XRP can surge higher or face a temporary dip before finding support.
Picks for you
FXGuys ($FXG) Receives Fresh Investment From Chainlink And Avalanche Holders Seeking The Next 100x Coin 20 hours ago XRP to trade at this price if spot ETF is approved, according to AI 20 hours ago Here's the 'only way' Dogecoin will go parabolic to $4 22 hours ago Buy alert as Stellar (XLM) signals imminent rally 2 days ago
In this context, the Ripple native token faces key resistance around $2.90, which could spark a bullish run. Support at $2.50 may provide a cushion for further consolidation.
XRP hits the exhaustion zone
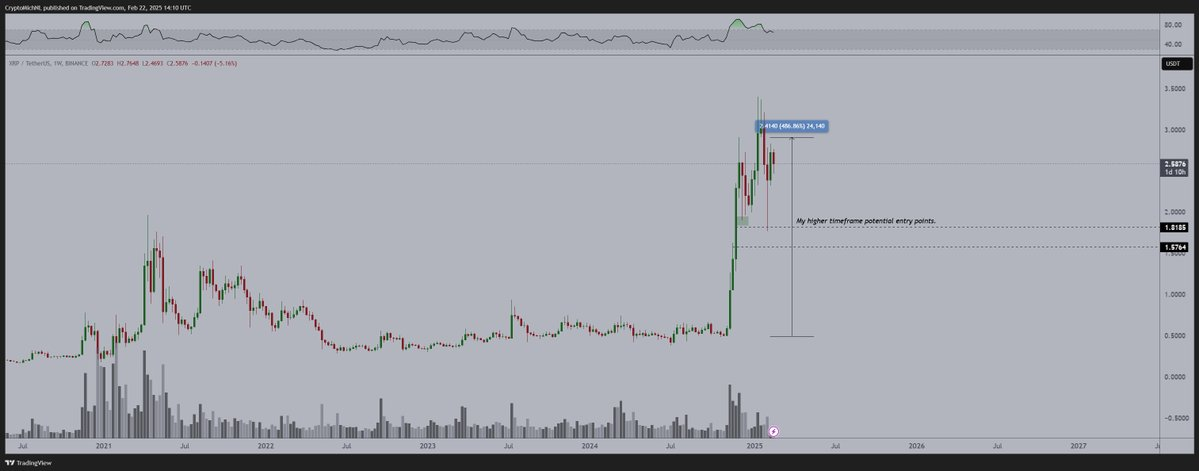
Similarly, uncertainty regarding XRP’s next move was shared by cryptocurrency trading expert Michaël Poppe. In an X post on February 22, Poppe acknowledged that after XRP skyrocketed 500% in just four weeks, reaching $3.30, the digital currency might be showing signs of exhaustion and a possible cooldown.
 XRP price analysis chart. Source: TradingView
Based on recent price movement and technical setup, Poppe suggested $1.50 to $2.25 as the next key accumulation zone, where long-term investors may find the best opportunities to buy the dip.
After three years of low volatility, XRP’s breakout was fueled by a surge in trading volume. Poppe believes most of the upside has already been captured, and consolidation is likely before another leg up.
“My best guess is that most of the upside is captured already and only the laggards are buying in at these levels. My second best guess is that we’ll consolidate before we continue to go up, which probably takes time. In that sense, you still want to be buying the dip if you’re interested in this one,” Poppe said.
To recap, XRP experienced massive price growth following Donald Trump’s election, as optimism grew regarding a potentially favorable regulatory environment.
Indeed, the extended consolidation of XRP below $1 was partly due to the ongoing legal case between Ripple and the Securities and Exchange Commission (SEC). Now, with a new administration in place, there is speculation that the SEC might dismiss the case or push for a favorable settlement.
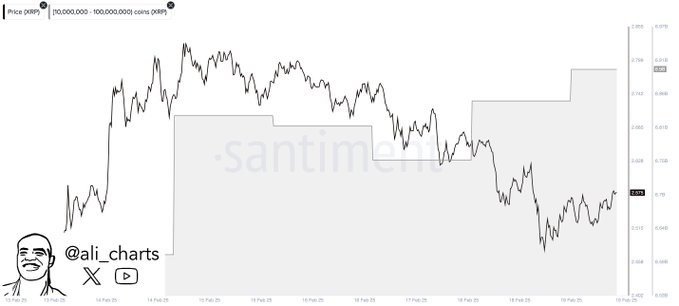
Despite the suppressed price movement, whale investors have shown confidence in XRP through continued accumulation. On-chain data from cryptocurrency analysis platform Santiment highlighted this trend.
According to data from the entity shared by Martinez on February 19, large investors accumulated 150 million XRP in 48 hours. Notably, such moves have historically been followed by price breakouts.
 XRP whale transaction chart. Source: Santiment/Ali_charts
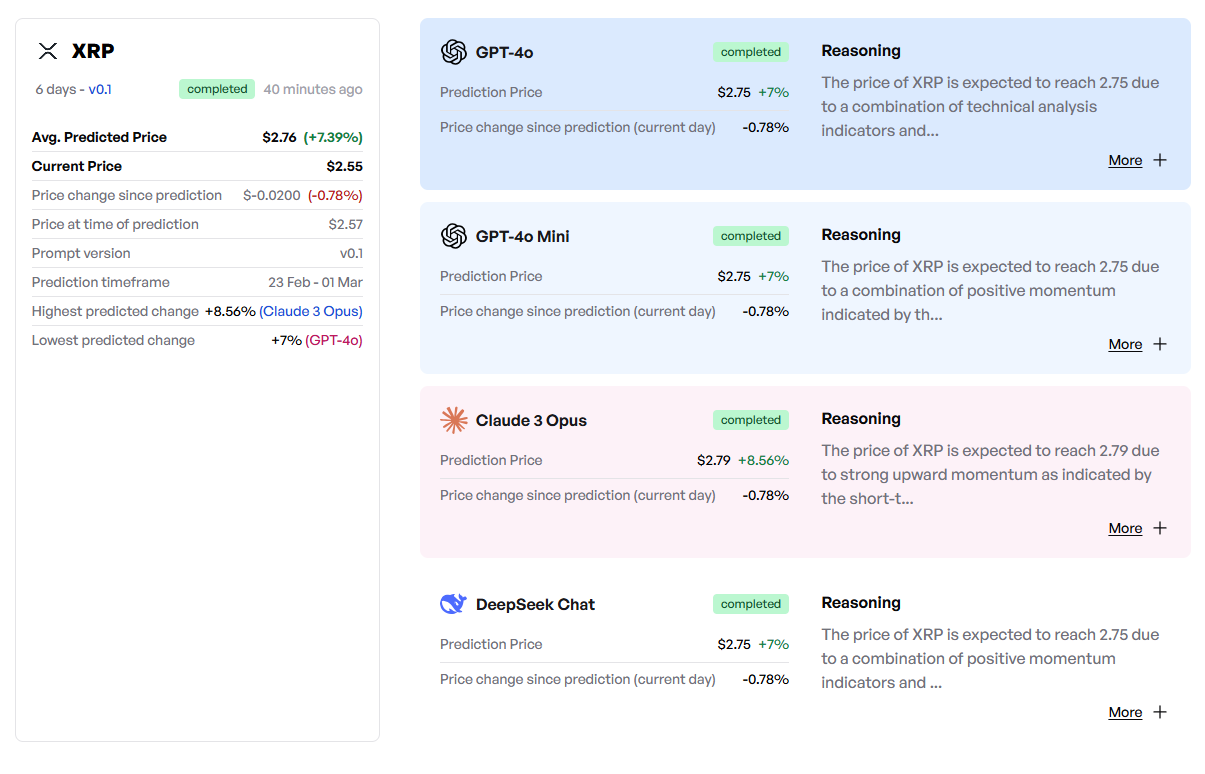
In this context, Finbold’s artificial intelligence (AI) tool projects that XRP will likely see some upside in the short term. According to the tool, which leverages several AI models, XRP will likely gain about 7%, trading at an average price of $2.76 on March 1.
Among the models, Claude 3 Opus has the highest forecast at $2.79, while ChatGPT-4o, ChatGPT-4o Mini, and DeepSeek Chat have set a target of $2.75. The generally bullish outlook is based on the asset’s technical indicators and positive momentum signals.
 Finbold AI XRP price prediction. Source: Finbold
XRP price analysis
As of press time, XRP was trading at $2.57, down about 0.7% in the last 24 hours. On the weekly chart, XRP had plunged over 7%.
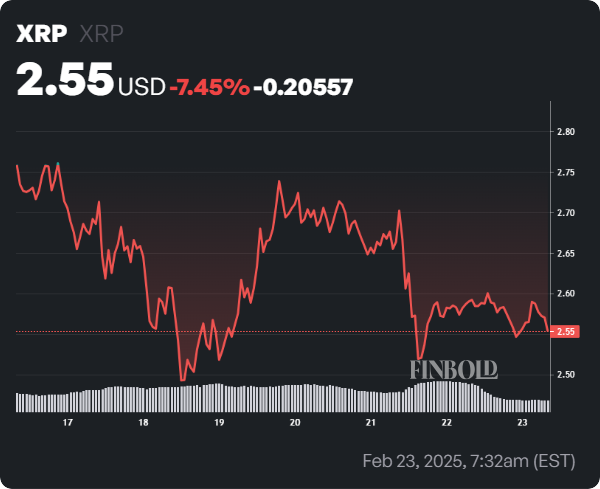 XRP seven-day price chart. Source: Finbold
XRP remains in a consolidation phase at the current price as it hovers below the 50-day simple moving average (SMA) of $2.68. This suggests the asset is neither strongly bullish nor bearish.
The 14-day relative strength index (RSI) is 50.87, indicating a neutral market stance with no immediate signs of overbought or oversold conditions.
For XRP to regain bullish momentum, it needs to reclaim $2.68, which could pave the way for further upside. The 200-day SMA at $1.43 presents a key long-term support level. If the price moves lower, the $1.50 and $2.25 range could be an ideal accumulation zone for investors anticipating another rally.
Featured image via Shutterstock