Grok 3 sets date when Bitcoin price will bottom 
![]() Cryptocurrency Mar 2, 2025 Share
Cryptocurrency Mar 2, 2025 Share
Bitcoin (BTC) continues to trade in bearish territory, extending its recent losses, with the $80,000 level emerging as a key support that could prevent further declines amid an alarming capital outflow.
Currently, Bitcoin is at a three-month low, trading below $90,000, as investors focus on identifying a potential price bottom before any rebound.
Finbold consulted xAI’s latest artificial intelligence (AI) model, Grok 3, to assess when Bitcoin might find a floor. According to the AI model, Bitcoin’s correction is nearing its final stages, with a potential bottom forming in the coming weeks.
Picks for you
Start of bear market? Investors pulling out of crypto at an alarming pace 1 day ago R. Kiyosaki slams Bitcoin ETF as ‘bankster’s money’ 1 day ago 2 cryptocurrencies with a 'weak' RSI status to buy this week 2 days ago ChatGPT says XRP price will hit this target by March 2025 2 days ago
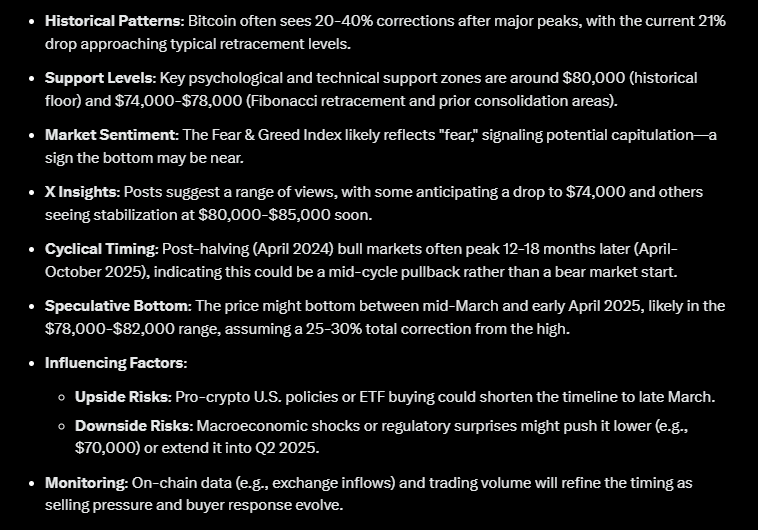
The downturn follows Bitcoin’s all-time high of $108,000 in late January. Grok 3 noted that historically, BTC experiences corrections of 20% to 40% after parabolic rallies, making the current pullback a typical occurrence.
In this context, the model highlighted key psychological and historical support levels, identifying $80,000 as a critical floor. In a worst-case scenario, Bitcoin could dip to the $74,000 and $78,000 range.
When will BTC bottom?
Bitcoin’s post-halving cycle also influenced Grok 3’s forecast. Following the April 2024 halving, historical trends suggest that bull markets typically peak 12 to 18 months later, implying a potential top between April and October 2025.
Given this pattern, Grok 3 suggested the current decline is a mid-cycle correction rather than the start of a prolonged bear market.
Based on past cycles, the AI model estimates Bitcoin could bottom out between mid-March and early April, likely stabilizing in the $78,000 and $82,000 range before consolidating.
 Bitcoin bottom outlook. Source: Grok 3
However, external factors such as regulatory changes, institutional demand, and macroeconomic conditions could influence this timeline.
A similar bottom range has been set by cryptocurrency analyst CrypNuevo, who noted that the asset is likely to rebound in March, as per a Finbold report.
Bitcoin in a macro trend shift
Indeed, technical indicators suggest Bitcoin is flashing signs of a significant macro trend shift based on the Bull-Bear Market Cycle Indicator.
According to data by CryptoQuant, shared by on-chain cryptocurrency analyst Ali Martinez on March 2, Bitcoin has entered an extreme bearish phase, with the indicator dipping below zero, a sign of deeper corrections.
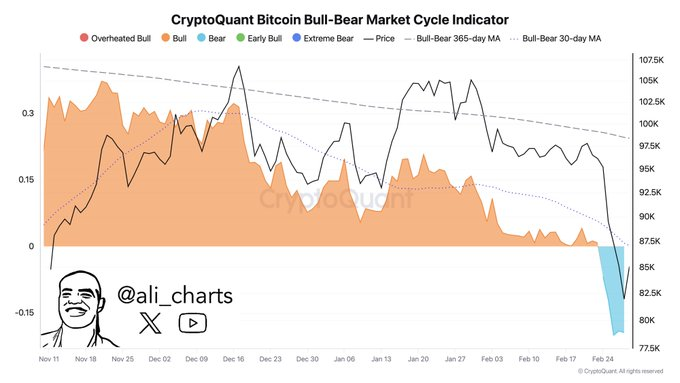 Bitcoin Bull-Bear Market Cycle Indicator. Source: CryptoQuant
The data indicates that Bitcoin’s price has been declining, with the indicator transitioning from early bull and bear phases to extreme bear. This implies that BTC is experiencing a notable downturn, potentially testing lower support levels.
The indicator tracks Bitcoin’s 365-day and 30-day moving averages (MA) to determine broader market trends. When the value moves below zero, the market enters a prolonged bearish phase or the late stages of a correction before a recovery begins.
Bitcoin on the verge of a rebound
Another CryptoQuant data set suggests Bitcoin could be on the verge of a rebound. Its on-chain trader realized loss margin has hit -14%, surpassing the typical -12% threshold that has marked market bottoms before a recovery.
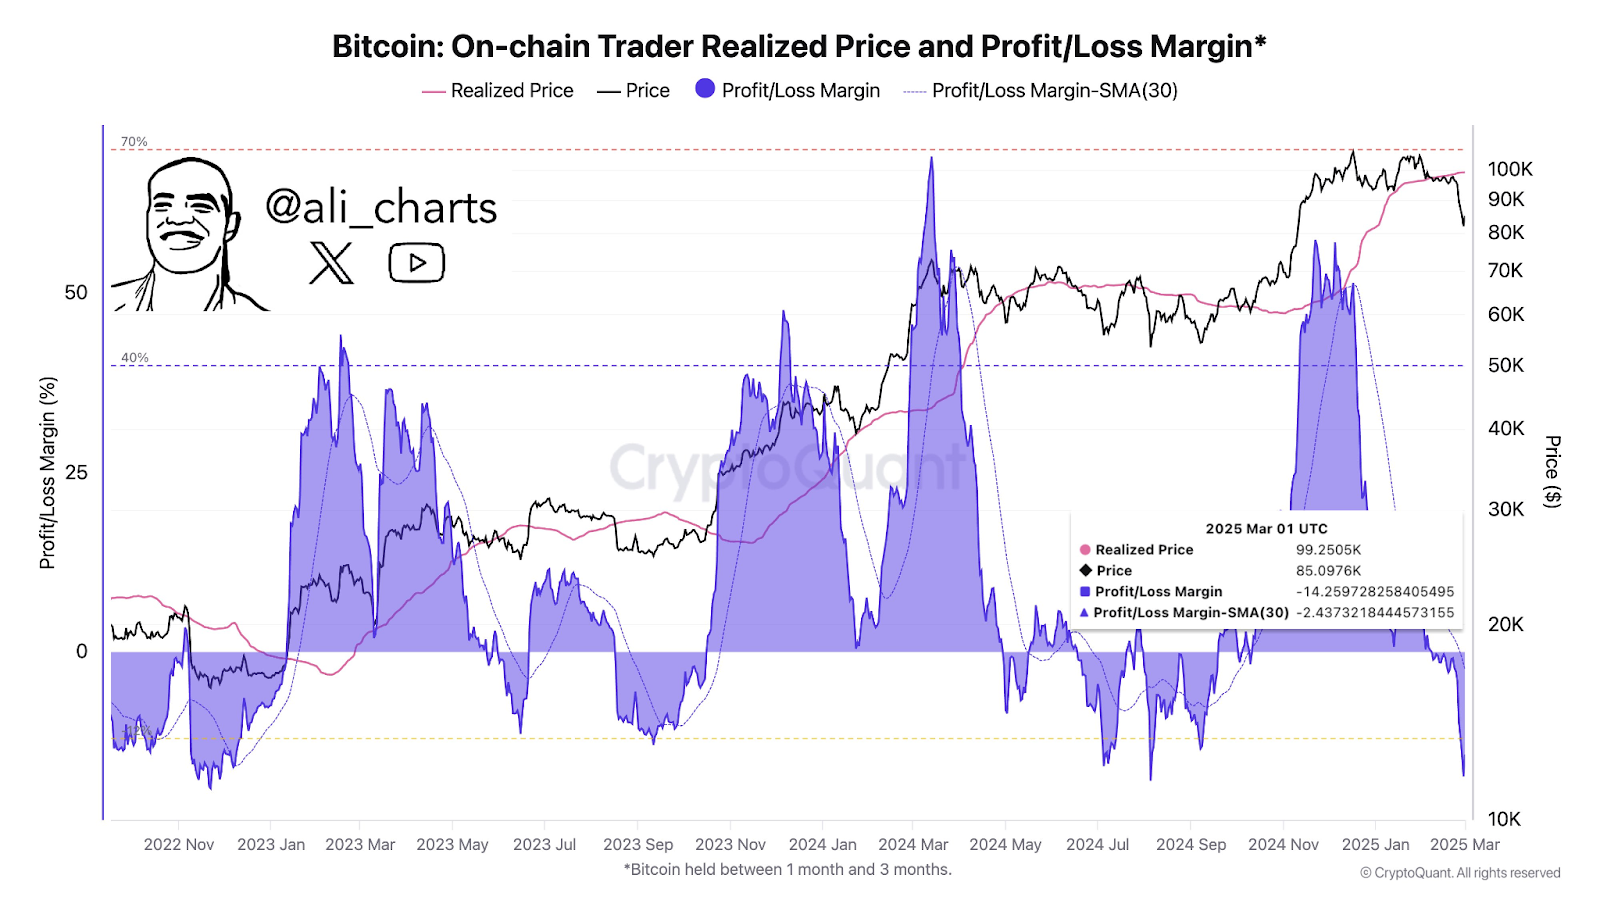 Bitcoin On-Chain Trader Realized Price. Source: CryptoQuant
Bitcoin’s realized price is $99,250, while its current price hovers around $85,000, leaving many short-term holders underwater. However, past data shows that such capitulation often precedes strong rebounds as sellers exhaust themselves and demand picks up.
If history repeats, Bitcoin could soon stage a sharp reversal, potentially retesting previous highs. Traders will be watching closely for confirmation of a recovery.
Meanwhile, on-chain data also hint at what to expect from Bitcoin. Specifically, Bitcoin’s active addresses have hit a three-month high, signaling a possible market capitulation and price rebound.
According to Glassnode data, active addresses surged past 912,300 on February 28, a level last seen on December 16, 2024, when BTC traded near $105,000.
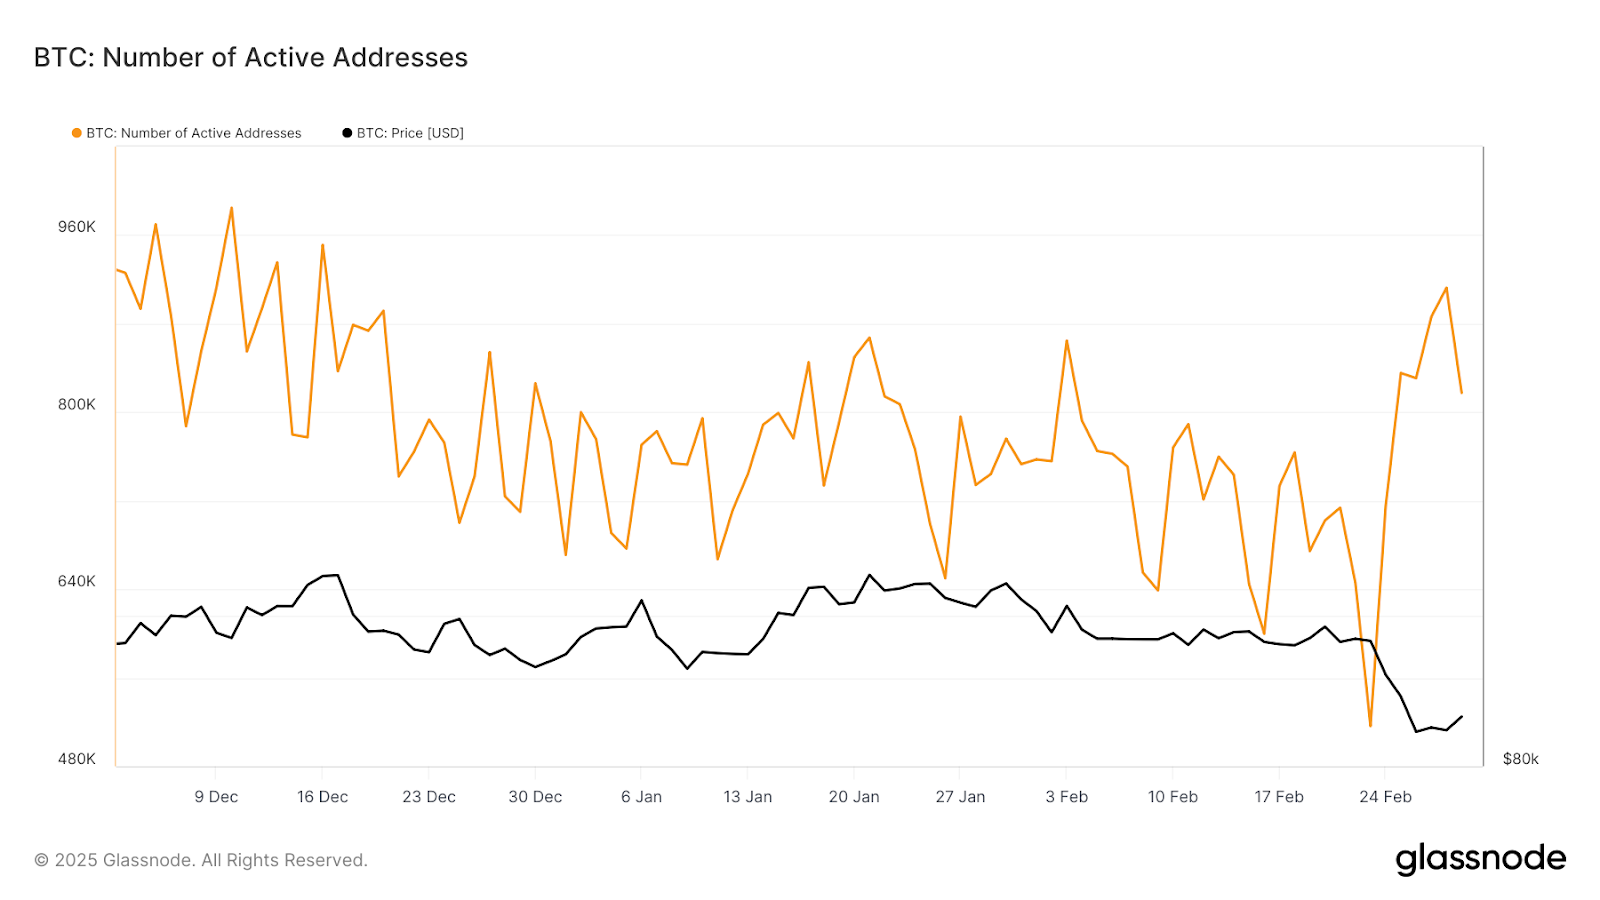 Bitcoin active addresses chart. Source: Glassnode
In this case, spikes in on-chain activity often mark market tops and bottoms, driven by panic sellers and opportunistic buyers. While not a definitive reversal signal, the surge suggests Bitcoin may be at a pivotal moment, with a rebound as the next possible move.
Bitcoin price analysis
As of press time, Bitcoin was trading at $85,867, gaining 1% in the past 24 hours. However, on the weekly timeframe, the digital currency has plunged over 10%.
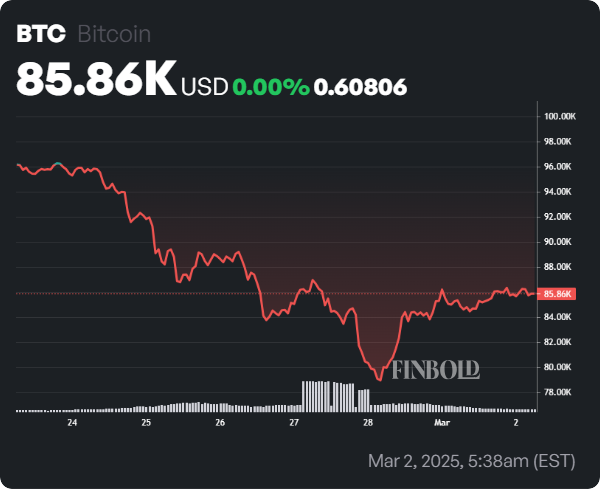 Bitcoin seven-day price chart. Source: Finbold
As things stand, Bitcoin’s $80,000 support remains critical to preventing further declines, while $90,000 serves as a key resistance. A break below could trigger more downside, whereas reclaiming $90,000 may confirm a rebound