Bitcoin bull market will be over if this happens, according to expert 
![]() Cryptocurrency Mar 4, 2025 Share
Cryptocurrency Mar 4, 2025 Share
Bitcoin (BTC) is trading in bear territory, but from a broader perspective, the asset remains in a bull market after reaching a record high of $108,000 in late January.
Now, technical indicators hint at when the bull market for the maiden digital currency might end.
Specifically, Bitcoin’s 50-week moving average (MA) is serving as a crucial support level, and a weekly close below it could signal the end of the ongoing bull market, according to crypto analyst Mikybull Crypto.
Picks for you
Two cryptocurrencies like XRP to turn $100 into $1,000 in 2025 42 seconds ago Crypto market wipes $80 billion in 24-hour crash 13 mins ago Here’s how much an early 2025 investment in Robert Kiyosaki’s portfolio is worth today 1 hour ago Bitcoin analysts set recovery roadmap from the crash up to $150,000 2 hours ago 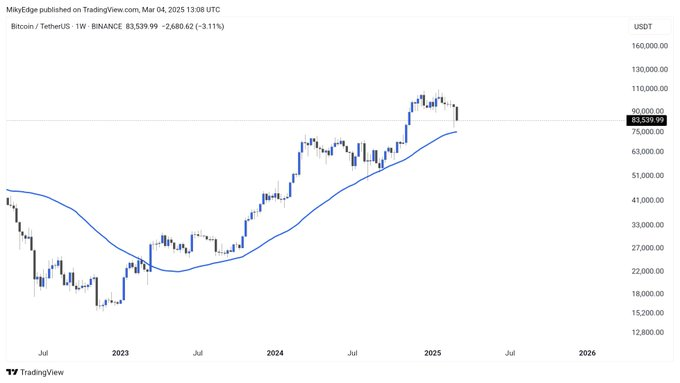 Bitcoin price analysis chart. Source: TradingView
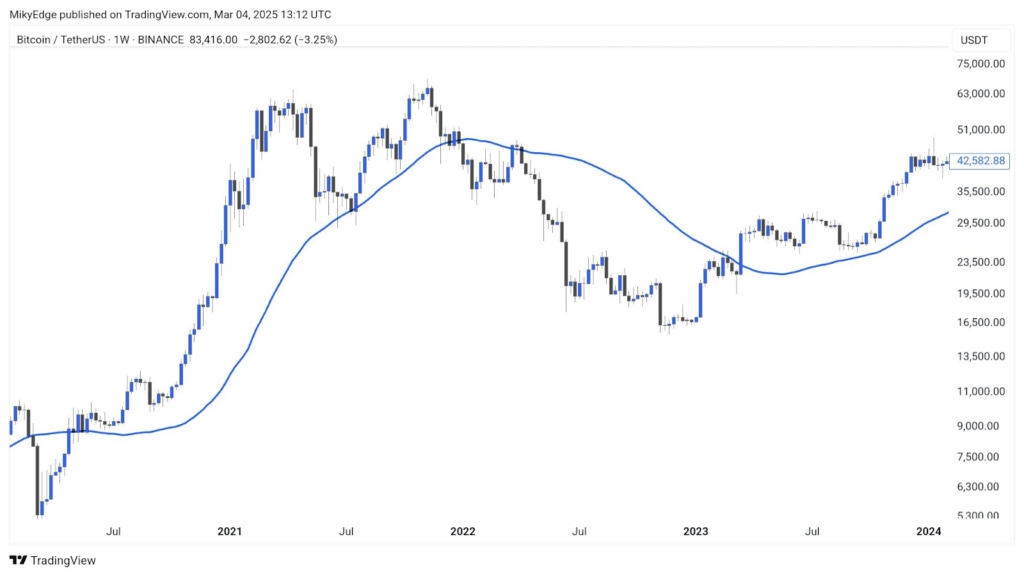
In a March 4 X post, the analyst pointed out that a similar breakdown in 2021 marked the end of that bull run. Bitcoin peaked at $69,000 before closing below the 50-week MA at $42,500, triggering a prolonged bear market. Today, BTC is testing this key level again, now at around $75,000.
 Bitcoin price analysis chart. Source: TradingView
The MA50 acts as a foundation during bull cycles, smoothing out price trends. Historically, losing this level has led to deeper corrections or the start of bear markets.
Bitcoin potential rebound zone
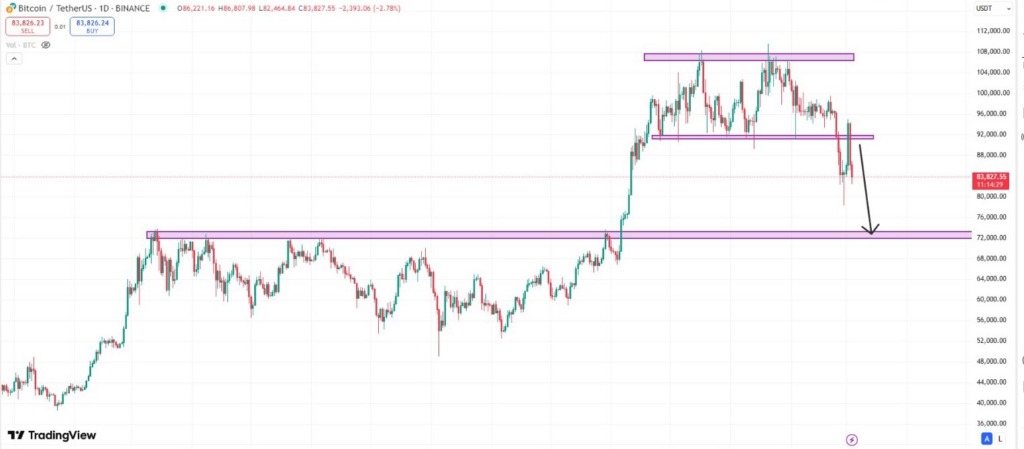
Meanwhile, analyst CipherX believes Bitcoin’s real move is yet to come, but investors should anticipate further losses before any upside push. In this case, the expert predicted a potential dip toward $78,000 before a strong bounce.
 Bitcoin price analysis chart. Source: TradingView
His outlook indicated that BTC recently faced a double-top rejection near $110,000, breaking below the $94,000 support range. The next key level sits around $78,000, a strong historical resistance-turned-support area. Therefore, if Bitcoin holds this level, it could trigger a rebound to new highs.
Bitcoin’s latest slump follows the hype around President Donald Trump’s strategic crypto reserves announcement, which briefly pushed the cryptocurrency above $90,000 before it tumbled.
The move sparked backlash, with critics like economist and Bitcoin skeptic Peter Schiff accusing Trump of a “crypto rug pull” for including multiple cryptocurrencies rather than focusing solely on Bitcoin as he promised on the campaign trail.
Adding to market jitters, Trump’s latest tariff plans are moving forward, fueling over $1 billion in liquidations across exchanges.
Bitcoin’s losses could also extend further as institutional demand weakens. In this line, on March 3, spot Bitcoin exchange-traded funds (ETFs) recorded a $74.2 million outflow, following $2.39 billion in net outflows last week.
If outflows persist, Bitcoin could test $80,000, a key level to watch. A deeper drop could invalidate hopes of a March rebound.
Bitcoin price analysis
Bitcoin was trading at $83,262 at press time, down 10% in 24 hours. On the weekly chart, losses stand at 6% as the bearish sentiments remain sustainable.
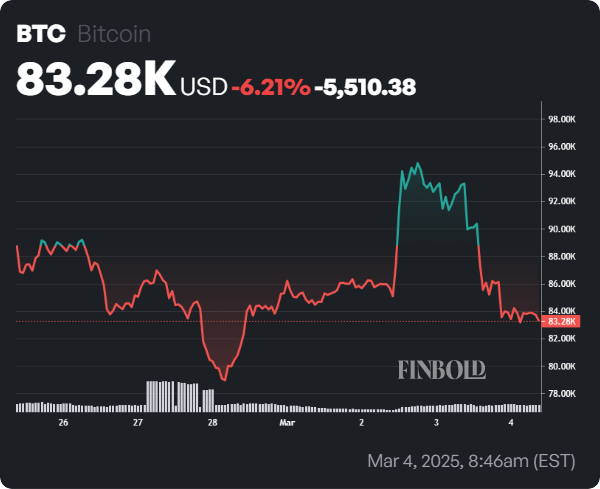 Bitcoin seven-day price chart. Source: Finbold
As things stand, Bitcoin’s price action hinges on the $78,000 and $80,000 support zone, where a breakdown could deepen losses, while a rebound may reignite bullish momentum toward $94,000 and beyond.
Featured image via Shutterstock