Bitcoin is trading at $104,071, with a total market capitalization of $2.067 trillion and a 24-hour trading volume of $30.25 billion. Over the last 24 hours, bitcoin moved within a price range of $103,108 to $104,836, indicating a narrow consolidation near recent highs.
Bitcoin
Despite exhibiting strong bullish momentum on the daily chart, bitcoin appears to be entering a consolidation phase, marked by waning volume and tight price action. The price action on the daily timeframe shows a sharp uptrend from approximately $74,588 to a high near $105,706, though the rally has paused with the price currently consolidating below this key resistance level. Volume has tapered, suggesting some buyer fatigue. Traders should monitor the $105,706 mark closely, as a decisive breakout with volume could reignite upward momentum. Conversely, a drop below the support zone of $95,000 could signal the start of a corrective phase.
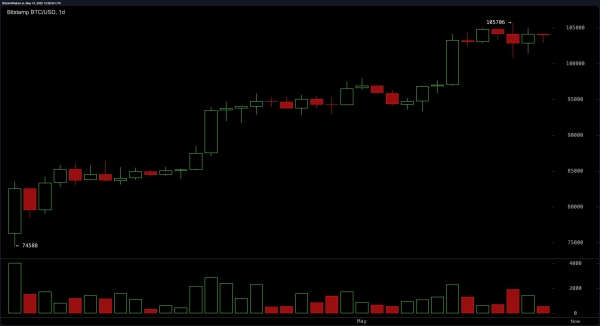 BTC/USD Daily chart via Bitstamp on May 14, 2025.
On the four-hour chart, bitcoin has formed a double top pattern around $105,706 before retracing to roughly $101,000, reflecting short-term bearish pressure. Although there has been a modest recovery, the lower buying volume compared to the preceding sell-off underscores cautious sentiment. The current structure leans bearish to neutral, with a breakout above $104,500 potentially reversing this sentiment. A failure to reclaim this level or a breakdown below $101,000 could prompt a test of the psychological $100,000 level.
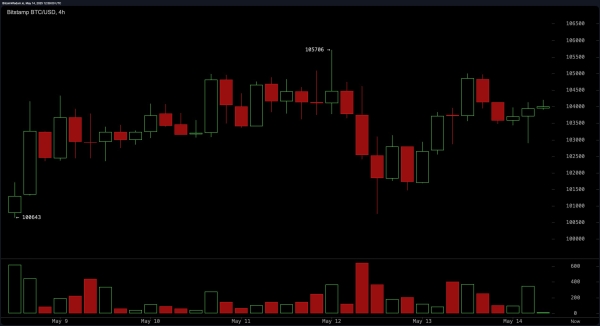 BTC/USD 4-hour chart via Bitstamp on May 14, 2025.
The one-hour chart illustrates a recent downtrend from $104,997 to approximately $103,000, followed by an attempt at recovery. This timeframe shows weaker bullish momentum, highlighted by a developing but fragile ascending trendline. Short-term selling pressure remains dominant as bearish candles have seen higher volume than bullish ones. A successful break and hold above $104,000 may invite scalpers, while a rejection at this level or a slip below $103,000 would confirm short-term downside risks.
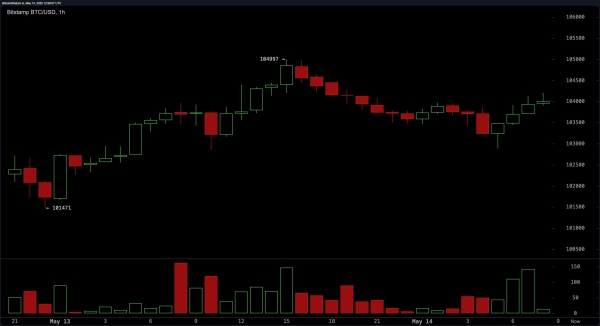 BTC/USD 1-hour chart via Bitstamp on May 14, 2025.
Oscillators present a mixed sentiment. The relative strength index (RSI) at 71 and the commodity channel index (CCI) at 102 both issue sell signals, indicating potential overbought conditions. In contrast, the momentum indicator at 9,766 and the moving average convergence divergence (MACD) level at 4,093 signal buying opportunities. The Stochastic oscillator at 84 and the average directional index (ADX) at 36 are neutral, reflecting market indecision and a lack of strong directional bias.
The moving averages offer a more uniformly bullish picture across all key intervals. Both the exponential moving average (EMA) and simple moving average (SMA) values from 10 to 200 periods confirm sustained upward momentum. The exponential moving average (10) and simple moving average (10) stand at $101,717 and $101,480 respectively, with longer-term averages like the simple moving average (200) at $91,970 and exponential moving average (200) at $87,679, all signaling strong support for continued price appreciation, provided bullish momentum sustains.
Bull Verdict:
With consistent buy signals from all major moving averages and daily chart momentum still in favor of the bulls, bitcoin maintains its structural uptrend. A breakout above the $105,706 resistance—particularly if backed by volume—could pave the way for new all-time highs, validating bullish continuation patterns seen across higher timeframes.
Bear Verdict:
Despite strong daily chart performance, oscillators reveal signs of exhaustion, and short-term charts display volume divergence and resistance near $104,500. If bitcoin fails to break higher and drops below the $101,000 to $100,000 support zone, it could initiate a broader correction, breaking the short-term bullish narrative.