Ethereum soars 26% in a day, adding $66 billion 
![]() Cryptocurrency May 9, 2025 Share
Cryptocurrency May 9, 2025 Share
Summary:
⚈Ethereum jumped 26.78% in one day, adding $66 billion in market cap
⚈ ETH now targets $2,476 and $2,739 resistances, with support at $1,934
⚈ Long/short ratio at 1.633 signals continued bullish momentum, low bearish pressure
In a 24-hour rally that started in earnest on May 8, Ethereum (ETH) rocketed 26.78% to its press time price of $2,451.
The sheer magnitude of the move is best seen in the change in ETH’s market cap, which surged by almost exactly $66 billion.
Early on May 8, the token’s valuation amounted to $232.84 billion, while at press time in the morning of May 9, it hit $298.88 billion.
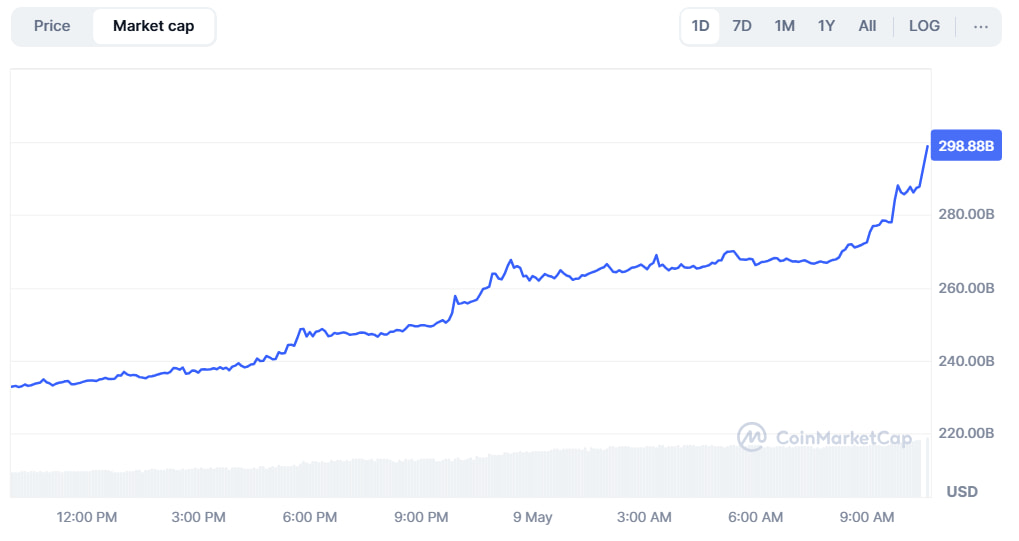 ETH market cap one-day chart. Source: CoinMarketCap
ETH has been among the few major cryptocurrencies that have failed to set a new record during the 2024 bull market and has generally underperformed expectations. The token’s cycle high was recorded on December 7, 2024, when the price exceeded $4,000.
Ethereum set its ATH at $4,721 on November 11, 2021, meaning the token would have had to rally 18.03% from its 2024 peak and 92.62% from its press time price to reclaim it.
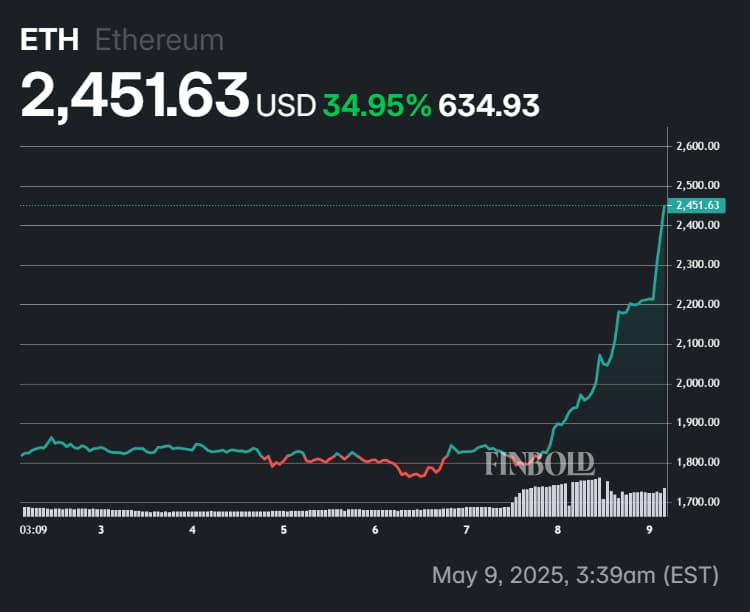 ETH one-week price chart. Source: Finbold
What is next for Ethereum after a 26% one-day rally?
The latest rally has, however, opened the possibility for the cryptocurrency to at least participate in the coming bull runs. ETH has been noted in recent months for offering only tame reactions to relatively widespread upswings, despite tending to fall together with the market in the downswings.
Looking ahead, Ethereum’s short-term performance will be decided by its ability to overcome the other two nearest resistances and remain above the closest support should a strong correction begin.
The token has already soared past its closest resistance near $2,336.90 and is, at press time on May 9, eying the levels at approximately $2,476.25 and $2,739.65. In case of a correction, it must remain above $1,934.15 to confidently retain the uptrend.
Lastly, examining ETH’s long/short ratio, it is encouraging to see it at 1.633 and above the May 8 lows, indicating the rally is yet to generate significant bearish pressure.
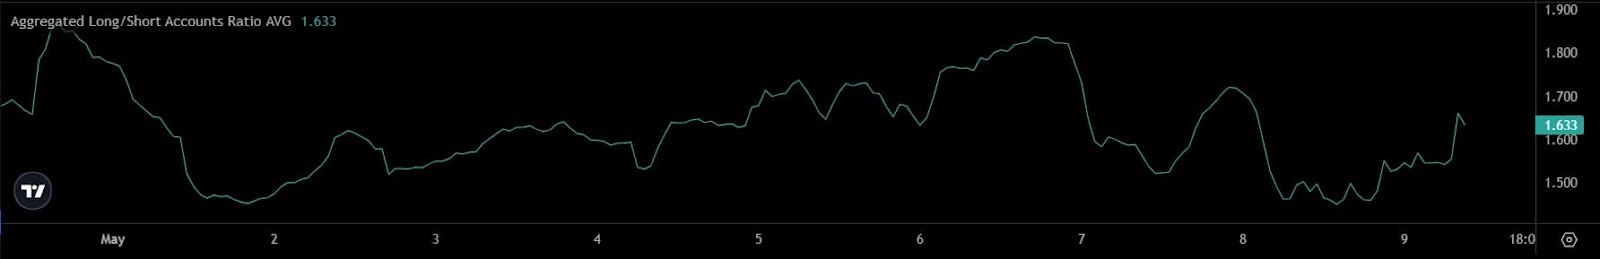 ETH long/short ratio chart for May. Source: Coinalyze
The balance between long and short positions paints a similar picture, as it is, in fact, lower in the shorter time frames. The 24-hour value stands at 39.28%, while the 4-hour one is at 37.60%, according to the data Finbold retrieved from Coinalyze on May 9.