Expert warns Bitcoin’s ‘Uptober will end as Downtober’ 
![]() Cryptocurrency Oct 23, 2024 Share
Cryptocurrency Oct 23, 2024 Share
Bitcoin’s (BTC) push to realize the ‘Uptober’ momentum is fading as the asset has struggled to claim the $70,000 mark. This grim projection is now backed by technical indicators that signal more downside for Bitcoin at the end of October.
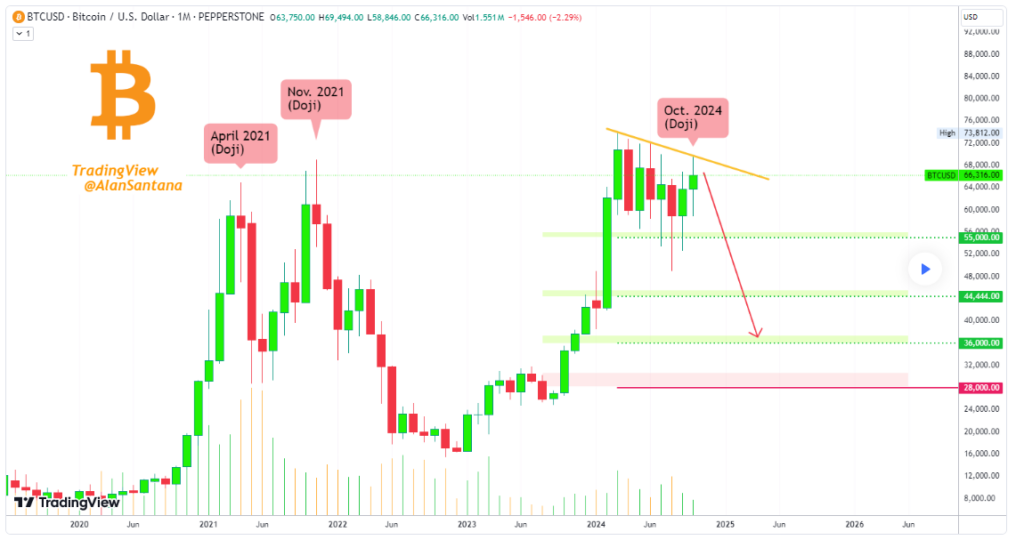
This bearish outlook has emerged based on parallels between the current Bitcoin price action and historical patterns from April and November 2021, warning that this month may end similarly with a drop, as Alan Santana noted in a TradingView post on October 23.
 Bitcoin price analysis chart. Source: TradingView/Alan Santana
Specifically, April and November 2021 saw promising starts with price gains, followed by abrupt reversals. Both months ended with a red candle, signaling the end of bull markets and ushering in substantial corrections.
Picks for you
Here’s the 'hidden factor' driving Silver prices higher 3 hours ago Here's why a Bitcoin smart trader is buying BTC right now 3 hours ago Commodity strategist warns gold’s parabolic rally ‘unsustainable’ if Kamala Harris wins 5 hours ago Are junior gold miners the best precious metal play right now? 6 hours ago
Santana noted that Bitcoin’s all-time high in early 2024 could be its peak for the foreseeable future, and the recent October rally is showing signs of weakening. The current session features a Doji candlestick pattern, suggesting indecision and potentially a bearish turn by the month’s end.
Therefore, according to the expert, if October 2024 closes in the red, it would confirm a major long-term lower high and may signal the start of a bearish phase for the maiden cryptocurrency.
Key Bitcoin support levels to watch
To this end, Santana highlighted key support levels at $55,000, $44,444, and $36,000, warning that Bitcoin could drop further depending on how this month closes.
“Uptober will end as Downtober. <…> This would be the start of a bearish impulse that will end an already ongoing major correction. The main support levels are $55,000, $44,000, and $33,000. It is possible that Bitcoin moves even lower but we have to wait and see how it all ends,” the expert stated.
The broader cryptocurrency market also shows signs of bearishness, with Ethereum’s (ETH) weakness reinforcing a downtrend among major altcoins.
Indeed, Bitcoin is now grappling to maintain its price above the $65,000 support, with concerns that dropping below this mark might signal more losses. There was optimism that the crypto could realize the ‘Uptober’ momentum after briefly claiming the $69,000 spot.
Bitcoin’s immediate test
However, some analysts, such as Rekt Capital, believe there is hope for the asset to rally in the coming days if it meets key conditions.
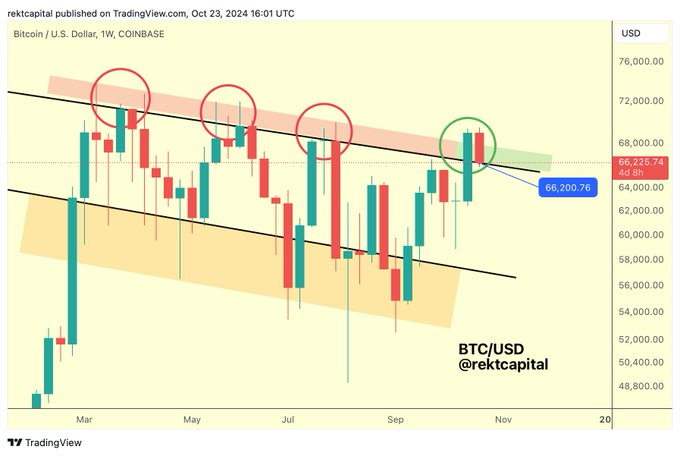
In an X post on October 23, the analyst noted that Bitcoin is undergoing a pivotal retest of the channel top, marked at $66,200. This retest is crucial in determining whether Bitcoin’s bullish momentum can be sustained.
 Bitcoin price analysis chart. Source: TradingView
After facing multiple rejections around this resistance area, Bitcoin is now attempting to flip it into support. While there is potential for temporary wicking below this level, the expert noted that attention now shifts to the asset’s weekly close.
Therefore, a successful close above $66,200 would confirm that this level is supported. However, failure to hold this level might signal a deeper pullback, allowing Bitcoin to test lower support zones.
As things stand, the next anticipated Bitcoin record high stands at the $100,000 mark, with analysts noting that to clinch this valuation, the leading digital asset needs to flip the $70,000 resistance and turn it into support.
The price target is supported by artificial intelligence analysis, which suggests that Bitcoin might trade near its last all-time high of above $73,000 by the end of October.
Meanwhile, concerns regarding possible short-term volatility persist, considering that Bitcoin futures open interest recently hit an all-time high, indicating increased market liquidity and speculation.
Bitcoin price analysis
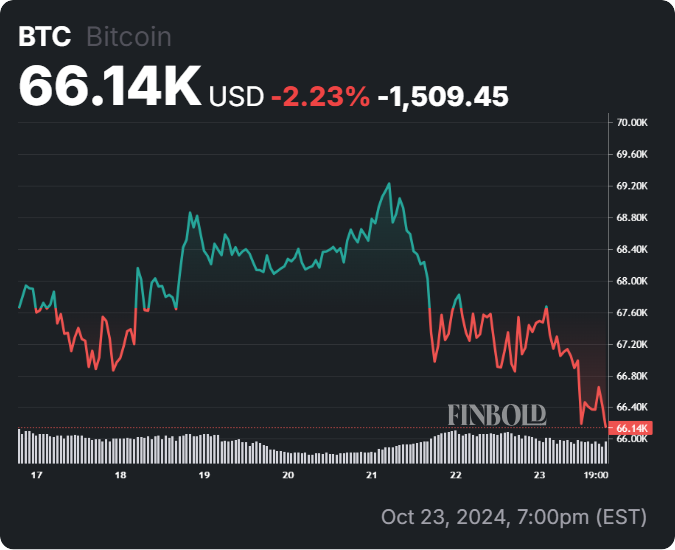
By press time, Bitcoin was trading at $65,874, with losses on both the daily and weekly charts at 1.61% and 2.23%, respectively.
 Bitcoin seven-day price chart. Source: Finbold
These valuations show that Bitcoin might still have some upside in the short and long term, considering the price remains above the 50-day and 200-day simple moving averages.
Overall, the immediate focus remains on how Bitcoin interacts with the current $65,000 support, as dropping below this level could signal more losses ahead.
Amid this short-term price sentiment, the long-term Bitcoin sentiment remains bullish, with several catalysts in store, such as the upcoming United States presidential elections.