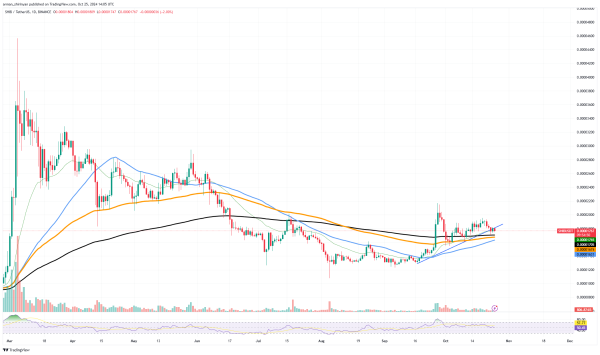
A potential golden cross, which has historically signaled large price increases for assets, is what Shiba Inu is slowly approaching right now. The golden cross formation has been progressively approaching reality as SHIB has been gaining momentum in recent weeks.
The market may move into a more bullish position when a shorter-term moving average crosses above a longer-term moving average. The 50-day EMA for Shiba Inu is currently getting close to the 200-day EMA, which is an essential component of the golden cross configuration. This crossover might spark a surge in fresh buying interest and raise SHIB if it occurs.

Even though the golden cross by itself does not ensure a price spike, many people view it as a sign of future growth, particularly when its accompanied by higher trading volume and improved market sentiment. As the asset bounced off important support levels and progressively regained strength, it has already demonstrated some resilience.
Although it is too soon to tell whether this golden cross will lead to an instant rally, the developments suggest that Shiba Inu is still competitive. The golden cross could be a powerful indicator of more bullish momentum if it forms successfully in the upcoming days or weeks.
All eyes are currently on SHIB’s key moving averages to see if they can sustain this upward trajectory in the direction of the golden cross. The asset’s potential for growth may rekindle interest in it and drive its price higher in the near future.
XRP being pressured
XRP is in danger of collapsing below a crucial support level, which might lead to a more substantial decline. For XRP the support level at about $0.50 has been crucial, serving as a barrier against additional declines on several occasions in the past. However, the likelihood of a breakdown increases as the asset stays close to this level. There will probably be more bearish pressure on XRP if it breaks below this important support.
The asset’s downward trend is further indicated by an impending death cross, which occurs when short-term EMAs cross below long-term EMAs. Death crosses have historically been a sign of strong bearish trends, which may portend a much more severe correction for XRP in the future.
Following a decline below the $0.50 support level, $0.45 and $0.42 are the next important support levels to keep an eye on. Although these levels might provide short-term respite from selling pressure if the death cross materializes, they are unlikely to stop a protracted downward trend. The death cross, along with breaking support, may make it much less likely that XRP will recover anytime soon.
Since the overall technical structure indicates that the trendline may not hold, the chart’s ascending trendline provides little support. With key technical signals pointing downward and momentum waning, XRP’s prospects appear increasingly dire unless it can hold onto its support above $0.50.
Before choosing its next course of action, XRP may experience some sideways consolidation if it is able to hold at this level. Given the current technical indicators, however, it appears more likely that there will be further downside. Though the charts suggest otherwise, XRP holders will be keeping a close eye on things in the hopes of a recovery.
Bitcoin still strong
Recent price changes indicate that Bitcoin (BTC) is not ready to give up just yet and the cryptocurrency looks to be staging a comeback. At the moment, Bitcoin is testing what was once the upper limit of a long-running downward price channel. This crucial level, which was once a powerful resistance, may now serve as support, laying the groundwork for Bitcoin’s reversal and future growth.
Bitcoin has demonstrated resilience in recent days, recovering from the crucial $65,000 mark, which now appears to be a crucial area of support. This might be the pivotal point at which Bitcoin rises. A successful hold at this level could signal a reversal and push the asset toward testing $73,000, the next key resistance level.
The fight is not over, though. Bitcoin still has trouble breaking higher in order to gain the traction it needs to remain stable above $65,000. The value of $62,800 is another important level to keep an eye on; it is located near the 100 EMA. Bitcoin may indicate a return to the downside and possibly test lower support levels if it is unable to hold this area.
Overall, if Bitcoin can hold onto its current support levels, its technical setup suggests room for more gains. A bullish continuation could now be initiated from the upper border of the descending channel. In order to determine whether Bitcoin is truly prepared for a long-term recovery or if further consolidation is in store, traders will be closely observing these levels. With these crucial levels at play, Bitcoin’s next moves will probably determine how it develops over the next few weeks.