What USDT dominance is telling us about Bitcoin’s price 
![]() Cryptocurrency Oct 26, 2024 Share
Cryptocurrency Oct 26, 2024 Share
Tether (USDT) has recently experienced sustained capital inflows, with the stablecoin hitting historic market cap levels. While such a trend is historically positive for the crypto market, analysis suggests that this momentum may not be ideal for Bitcoin (BTC).
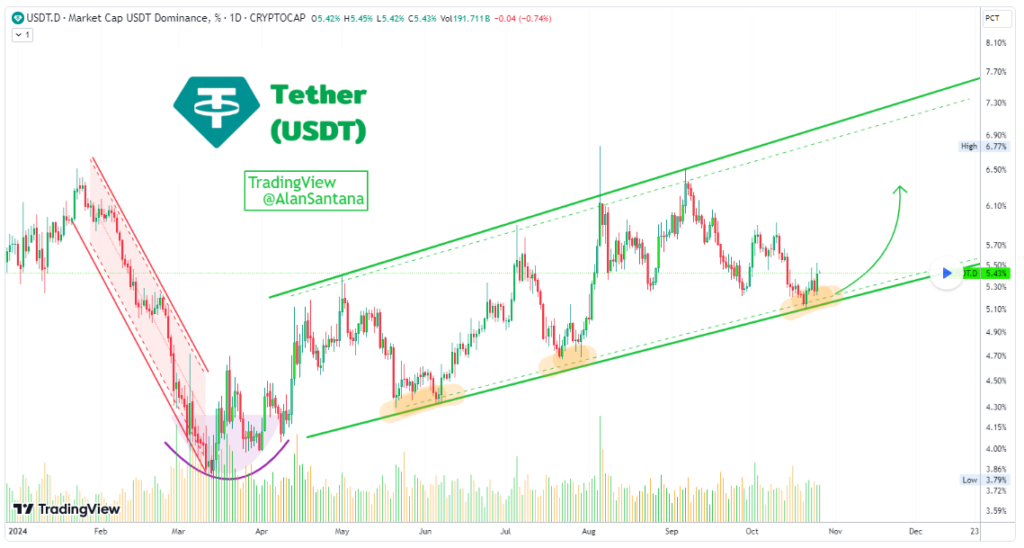
Specifically, USDT dominance has been rising, a factor that could signal a possible reversal in Bitcoin’s price, which is attempting to breach the $70,000 spot and possibly target a new all-time high, according to an analysis by Alan Santana shared in a TradingView post on October 26.
 USDT market dominace chart. Source: TradingView
It is worth noting that Tether’s dominance highlights the market share of USDT among all cryptocurrencies. The metric is a barometer for market sentiment and liquidity flow between stablecoins and other assets like Bitcoin.
Picks for you
2 signals that a memecoin is a rug pull created to get your money 3 hours ago Here’s how Cardano taps into Bitcoin’s $1.3 trillion liquidity 20 hours ago S&P 500 rallies to best 12-month performance since 1954 — What’s next? 21 hours ago U.S. government takes action after hacker returns $19 million stolen crypto 21 hours ago
Santana noted that from early 2024 to March, the stablecoin’s dominance steadily declined, forming a rounded bottom that hinted at a potential end to the bearish phase.
Following this, USDT entered an ascending channel, consistently finding support at the lower boundary and sparking bullish moves within the channel.
What USDT dominance means for Bitcoin
The analyst observed that bullish rebounds in USDT dominance often coincide with downward pressure on Bitcoin, while declines typically lead to Bitcoin rallies.
For example, between September 6 and October 21, Tether’s decline aligned with a strong Bitcoin upswing.
Rising USDT dominance suggests more investors are holding stablecoins, signaling caution or hedging against volatility, often preceding downward moves in Bitcoin.
Stablecoins are widely considered a bridge to entering the crypto space, with USDT ranking among the notable coins due to its substantial $120 billion market cap. In this context, some market players argue that capital inflow into stablecoins indicates investors’ anticipation of a potential market rally.
Tether’s legal controversy
Amid this capital inflow in USDT, the market remains in a precarious position. Reports suggest that the United States government is investigating Tether for potential sanctions violations and anti-money laundering regulations.
The news rattled the cryptocurrency market, halting Bitcoin’s momentum toward reclaiming $70,000. Given that USDT holds a significant market cap of $120 billion, such developments could shake the market.
Interestingly, Tether has publicly denied the existence of such an investigation.
“These stories are based on pure rank speculation despite Tether confirming that it has no knowledge of any such investigations into the company,” Tether said.
Despite this assurance, some market sentiment remains uncertain, hinting at fears that the token could lose its dollar peg and collapse.
Imagine selling crypto for $USDT because you are scared of $USDT collapsing 🤡
make it make sense lmao. Tether FUD is still the best bullish signal after 6 years. pic.twitter.com/iSlrweWRx9
— Dead Cat Bounce (@DCBcrypto) October 25, 2024
What next for Bitcoin
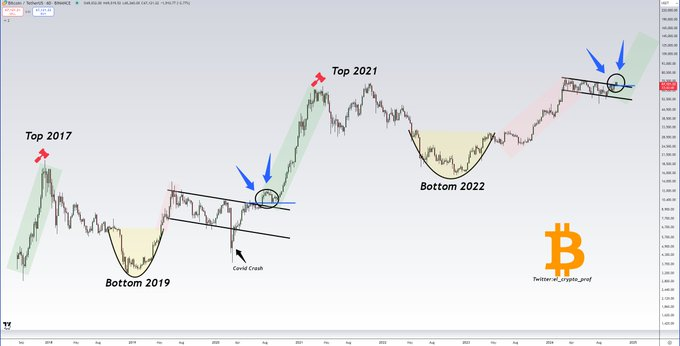
Meanwhile, a cryptocurrency analyst with the pseudonym el_crypto_prof shared on X on October 26 that Bitcoin appears to be mirroring the same structural pattern it followed in 2020, just before the explosive bull run.
According to the analyst, Bitcoin’s recent breakout and subsequent retest resemble the early setup of 2020’s rally.
With this retest phase underway, Bitcoin may be primed for a push to a new all-time high. The analyst suggests that recent pullbacks should be viewed as opportunities rather than setbacks.
 Bitcoin price analysis chart. Source: TradingView
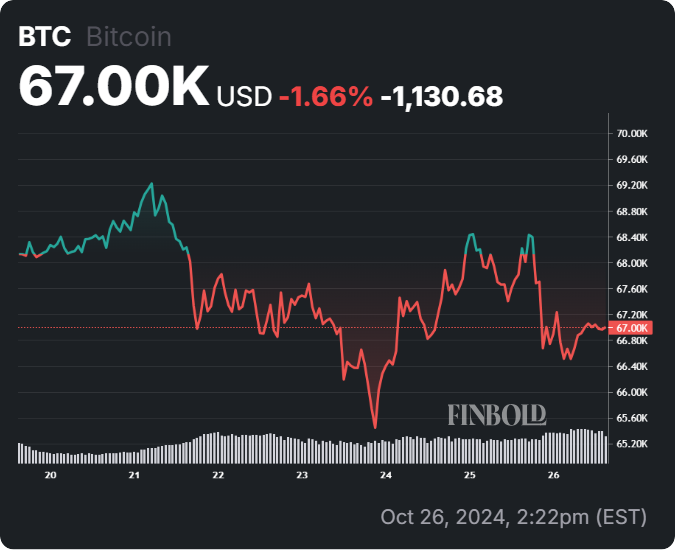
At press time, Bitcoin was trading at $67,003, down 1.4% in the last 24 hours and 1.6% on a weekly timeframe.
 Bitcoin seven-day price chart. Source: Finbold
Overall, Bitcoin is struggling to clinch the $70,000 resistance, which, if breached, could likely validate the “Uptober” momentum. Some enthusiasts project new highs in October, and artificial intelligence tools support this outlook.
A rally to a new all-time high would likely reignite debate around Bitcoin’s status as a store of value, especially given rising gold prices.
This is particularly relevant in light of a recent Finbold report indicating that gold is currently outperforming Bitcoin amid ongoing discussions about the ideal hedge asset.