Why XRP’s next move is a drop to $1 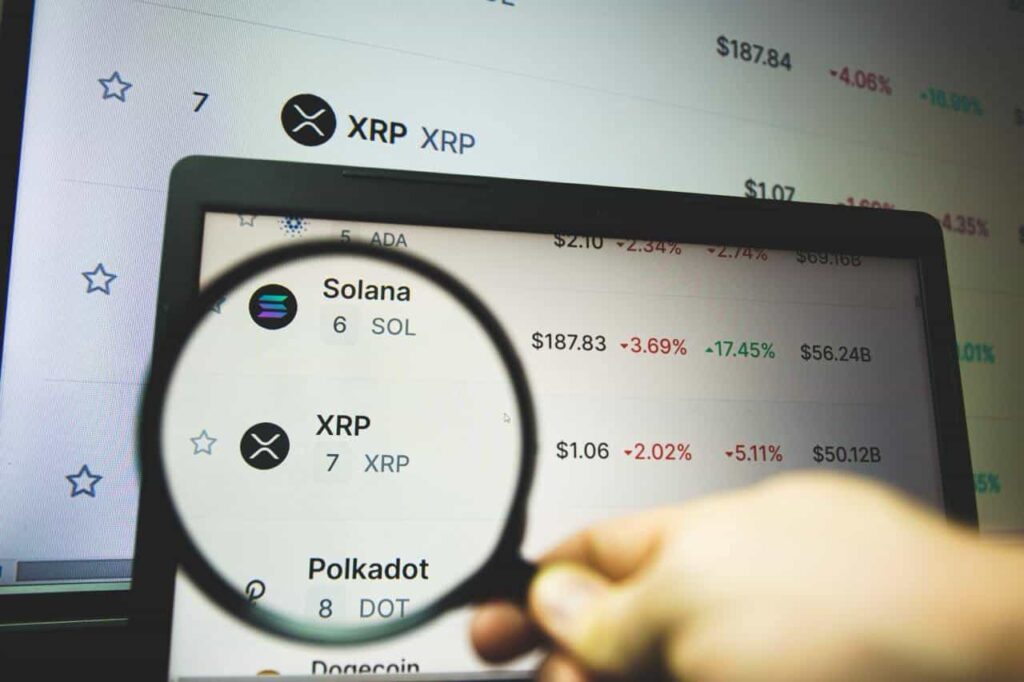
![]() Cryptocurrency Mar 2, 2025 Share
Cryptocurrency Mar 2, 2025 Share
XRP has staged a short-term recovery, pushing the asset to hold its price above the $2 support level, though technical indicators are flashing warning signs.
The asset is currently forming a head-and-shoulders pattern, a bearish signal that could foreshadow a drop toward $1, according to cryptocurrency analyst Ali Martinez in an X post on March 1.
The pattern features three peaks: the left shoulder forms after a price rally and decline, the head rises higher before another drop, and the right shoulder mirrors the left at a lower peak. The neckline acts as support, and once breached, it typically confirms a bearish trend.
Picks for you
Grok 3 sets date when Bitcoin price will bottom 3 hours ago Start of bear market? Investors pulling out of crypto at an alarming pace 1 day ago R. Kiyosaki slams Bitcoin ETF as ‘bankster’s money’ 1 day ago 2 cryptocurrencies with a 'weak' RSI status to buy this week 2 days ago
Martinez’s analysis suggests that the neckline is around $1.90, and a break below this level could signal a further downside. A confirmed breakdown would indicate rising selling pressure, with a price target based on the pattern’s height.
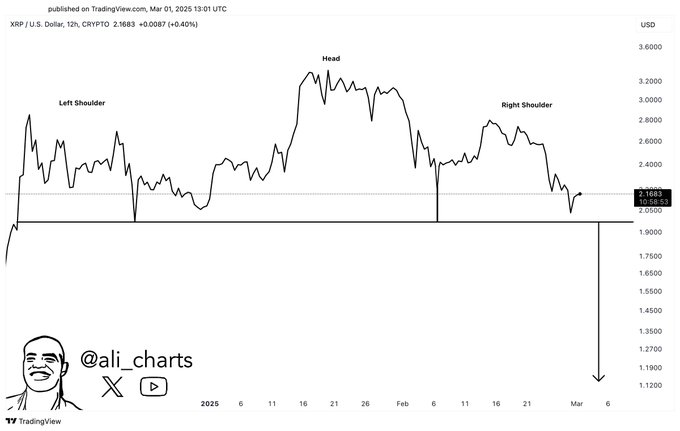 XRP price analysis chart. Source: TradingView/Ali_charts
The projected drop after a head-and-shoulders breakdown typically equals the distance from the head’s peak to the neckline.
With XRP’s head near $3.20 and the neckline around $1.90, this implies a downside target of $1.10 to $1.20. A rising trading volume below $1.90 would solidify this bearish outlook, while a rebound above it might stave off the decline and ignite a rally.
Is XRP poised for a breakout?
On the flip side, pseudonymous analyst Dark Defender offered a more upbeat take in an X post on March 2. The expert sees XRP poised for a breakout that could pave the way for a new all-time high.
In this line, the token’s daily Relative Strength Index (RSI) recently showed a double bottom and is nearing a golden cross, a bullish signal hinting at upward momentum.
Based on Elliott Wave analysis, Dark Defender flagged $2.33 as immediate resistance and $1.99 as key support. Clearing $2.33 could propel XRP toward $3.39 and even $5.85 in the short term.
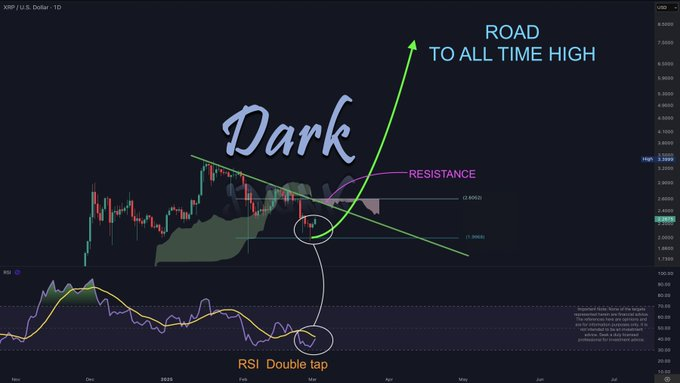 XRP price analysis chart. Source: Dark Defender
Still, XRP’s price isn’t moving in a vacuum; it’s tied to the broader crypto market, which has been sliding under Bitcoin’s lead. Beyond that, the ongoing Securities Exchange Commission (SEC) lawsuit against Ripple remains a major wildcard.
As Finbold reported, the case continues to sway XRP’s trajectory, especially with new, seemingly crypto-friendly regulators at the SEC.
While the agency recently dropped charges against companies like Coinbase, Ripple’s exclusion has dampened investor enthusiasm after a massive 539.62% surge fizzled out in January.
Notably, reports indicate that the SEC might either settle or drop the case entirely, but the uncertainty is keeping investors on edge.
Adding to the mix, the potential approval of spot XRP exchange-traded funds (ETFs) could unleash significant capital inflows. The SEC has until mid-October to decide. Meanwhile, the scheduled unlock of 1 billion XRP tokens in March could stir up more volatility.
XRP price analysis
As of now, XRP is trading at $2.25, up over 4% in the last 24 hours but down 12% over the past week. Despite these modest gains, the outlook leans bearish; its price sits below the 50-day simple moving average (SMA) of $2.68.
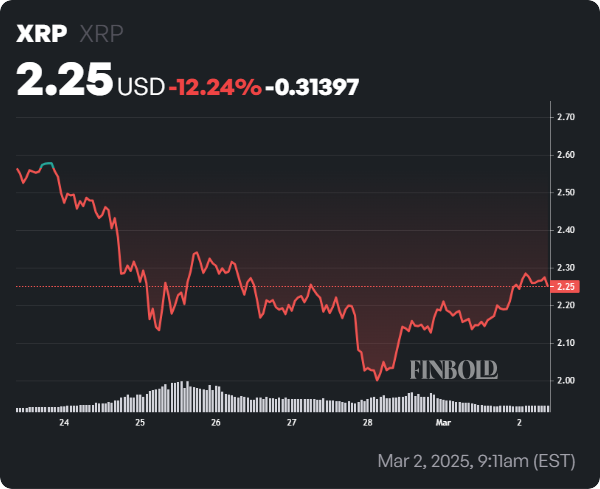 XRP seven-day price chart. Source: Finbold
That said, XRP is comfortably above the 200-day SMA of $1.51, hinting at a longer-term uptrend. The 14-day RSI, at 34.90, suggests XRP might be oversold, which could spark a bounce if buyers step in.
Featured image via Shutterstock